
This post examines the Falkland Islands Government’s initiative to install network ‘probes’ in the Sure network to measure broadband speed as a Key Performance Indicator (KPI). This initiative was the main driver behind introducing the KPI concept. The post does not cover basic network KPIs such as availability, reachability, or mean time between failures.
This is the longest post ever on OpenFalklands and possibly the most boring! Unless you’re really into this topic, feel free to skip it. The content of this post is only based on publicly available information and my opinion.
Although I had written much of this post in 2021, I put it on hold because I wanted to wait until the programmes’ success, or lack thereof, had been clarified. Despite growing public interest, as far as I know, no speed data from installed probes have been released since the programme’s inception.
I have written at least four posts about the challenges of creating KPIs for measuring speed or Quality of Experience of Sure’s Broadband network, including:
- March 2019: The enigma of monitoring the quality of the Falkland Islands’ broadband service – Part 1 and Part 2
- August 2019: Falkland Islands’ Regulator’s QoS Direction, Part 1 and Part 2.
One of my comments made in a 2019 post was:
“It will be interesting to see if the attempts by the Regulator for the provision of these services. bear fruit, and the Falkland Islands can once again have independent monitoring of the broadband system in place.”

What are ‘network probes’?
A network probe is a tool used to monitor, analyse, and inspect network traffic. It can be a hardware device or a software application that gathers information about network activity and performance. There are different types of network probes, including passive probes, which monitor traffic without interfering, analyse data flow, detect anomalies, and gather performance metrics. Active probes generate test traffic to check network performance and availability. Performance probes measure key metrics such as latency, bandwidth usage, and packet loss. Network probes are commonly used for network performance monitoring, troubleshooting, diagnostics, and compliance enforcement. They help identify bottlenecks, ensure optimal connectivity, and maintain efficient network operations. It is believed that the probes installed in the Falklands are passive.

History of the ‘speed’ KPI
15th September 2017: The first mention of a wish to use probes to monitor the performance of Sure’s broadband networks as a future recommendation was in the 2017 Regulator’s report. “Recommendations are made by David Brown acting in the capacity of Regulator.
2017″
- “Independent validation of agreed information provided by Sure. The Regulator is considering a passive monitoring of some Sure information to assist in assessing the consumer experience. This may give reassurance to Sure and the consumer that an objective benchmark is available. The measurement of variations in service such as the slowing down of service during periods of high network utilisation must be clear. This has a significant impact on consumer satisfaction and clarity on the level of service both against the KPI and normal operation must be properly considered.
2. That Sure and the Regulator agree on how the information gathered under recommendation 1 is interpreted. The information must then be presented in an easily understandable and accessible way so that consumers are able to judge performance objectively. Consideration should be given to using international benchmarks or quality of service targets to properly inform customers of the service being received.”“Passive monitoring is one mechanism through which this can be achieved. Before any monitoring can be considered the KPIs have to be developed and implemented; this is a priority area for the Communications Regulator in 2018.”
1st July 2019, the Falkland Islands’ Communications Regulator issued a ‘Direction to Sure Falkland Islands, No 2019/01a Quality of Service‘ (now deleted online) which required Sure Falkland Islands (Sure) to provide information on QoS speed data of the island’s broadband services.
August 2019: OpenFalklands published a highly critical analysis of the Direction. Part 1 was a technical analysis while Part 2 discussed its viability. In my opinion, at the time, the Directive failed to provide a deliverable and practical technical methodology to measure broadband speed Quality of Service.
Others seemed to have agreed with my analysis, as not long afterward, the Direction was revoked in March 2020. This was acknowledged in the Regulator’s March 2021 annual report:

“In July 2019, A Direction was issued to Sure to commence measurement of key Quality of Service (QoS) indicators. The Direction was intended to be the foundation stone of QoS measurement and reporting with more parameters and targets added over time. Due to difficulties with the technical measurement and collection of data the Regulator revoked the Direction in February 2020.”
17th December 2020: Sure was issued a new Direction to Sure South Atlantic Limited (“Sure”) establishing Quality of Service Standards for Public Electronic Communication Networks and Services. This QoS Direction was much more considered and comprehensive than the previously cancelled, and was welcomed for its focus on a broad set of objective performance data. It covered key technical metrics such as fault repair times, planned and unplanned outages, Mean Time Between Failures, service delivery times, and overall service availability, each with a measurable KPI based on objective data.
I saw the introduction of these KPIs as a significant step forward in understanding and to help improve the quality of Sure South Atlantic’s service provision. One of the KPIs specified that the islands’ broadband service should maintain a quarterly uptime (i.e. time without total blackouts) of over 99% measured over three months.. This metric was straightforward to calculate and use as a KPI. However, this was set at much lower than the average Service Level Agreement (SLA) availability KPI for ISPs, which is typically 99.9% or 8.76 hours of downtime per year. There were quite a few other questionable points.
An availability KPI of this nature is relatively straightforward to measure, report and set as a KPI as the data is black & white and easy to measure. However, defining a broadband speed KPI of any flavour is riddled with issues. While measuring real-time download speed degradation (grey-outs) is technically possible, using that data as the basis of a meaningful performance KPI is probably not deliverable – an issue I explored extensively in my previous posts.
19th January 2021: The following pubic information about broadband KPI monitoring ambition came with the Consumer Safeguards Policy document. This paper provided background information on the March 2020 QoS & KPI Direction given to Sure in January 2020. In addition, it offered some views about delivering a KPI based on broadband speeds.
“Setting Key Performance Indicators for broadband speeds and targets is dependent on the ability to measure upload and download speeds. Not only does there have to be a mechanism for measurement, it must not degrade the service it has been set up to measure. It also has to have the confidence of all stakeholders.”
“A project to purchase and install broadband probes is being taken forward jointly by Sure and the Regulator, with financial support from the Falkland Islands Government. The aim is to install probes at representative locations in Camp and Stanley so as to measure upload and download speeds for broadband services on both fixed and 4G mobile networks.”
Unfortunately, the adopted approach did not directly measure users’ upload and download speeds, which was the main objective in wanting KPIs in the first place.

‘Consumer Safeguard Policy’ document
I undertook a detailed critique of this paper when it was issued, so I will not discuss it further here.
The paper stated that there were three ways in which broadband speed may be measured:
Option 1: Inserting measurement probes on the application layers (such as FTP or HTTP) at defined points on the end-to-end path providing statistical values of upload and download data rates on all connections up to a specified server.”
[2021 comment]: A dedicated server must be installed at each point to provide consistent performance results. It would not be based on FTP or HTTP protocols but other protocols that measure round time trip times (RTT) or injecting packets to measure sppeds. This would be a costly and cumbersome approach and would only provide limited data on a limited number of links and certainly NOT upload and download speeds.
Option 2: Providing some test users with dedicated routers connected between their broadband box and device – reporting to the operator in charge of the “speed test” the actual values of download and upload speeds which are measured at the end user level.”
[2021 comment]: Correct, this would provide sensible measurements. This was the basis of the Actual Experience programme which ran from 2010 to 2015 although that used software arther than hardware.
Option3: A third possibility, which is not a real measure of the network performance, is to have online measurements activated by end users through a web server (such as OOKLA).”
[2021 comment]: Incorrect; In the real world, it does not matter what the “real network” performance is – the only thing that matters is what a customer experiences in their home or business. Of course, network performance metrics are important to Sure but they cannot be translated into what an individual user with experience.
There was a lot more discussion, but the final decision taken by ExCo was as follows:
“In the Falkland Islands the Regulator considers it to be unrealistic for any measurement to be wholly independent of Sure. The best outcome for consumers is for the Regulator and Sure to work collaboratively on identifying the best option for monitoring. The solution needs to be adequately scalable and the Regulator also has to take into consideration whether the cost of monitoring could be better spent on improving network infrastructure. In essence, the Regulator needs to decide whether the need for broadband speed monitoring is of sufficient priority to justify the cost involved.”
Although not stated, it looked like Option 1 was chosen, thus not measuring the user’s upload/download speeds. This was also the most expensive option as it involved purchasing hardware for each location selected to host a probe. Moreover, it is not data provided by an independent 3rd party, so any results obtained might not be trusted.

The installation of Probes
25th February 2021: FIG Press Release in respect of Probes.
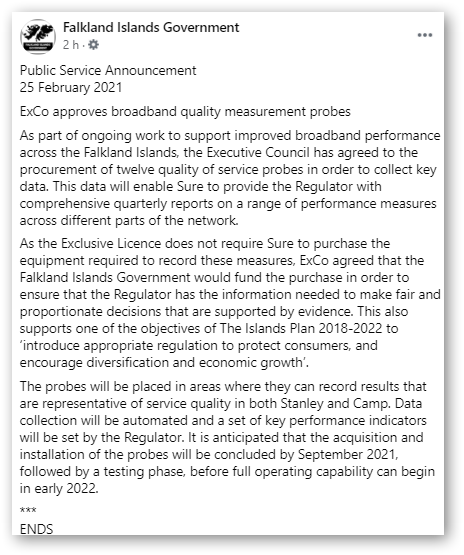
“Having considered the options and costs both in collaboration with Sure and independently, the Regulator believes the most pragmatic, proportionate and cost-effective approach is for Sure to insert measurement probes on its network.”
“Once the probes have been installed and commissioned, data will be collected and analysed by the Regulator. This will allow for relevant and realistic KPIs to be set, probably in 2021, and a further Quality of Service Direction to be issued to Sure, subject to consultation.”

24th February 2021: The FIG Executive Council approved the financing of the Probes in ExCo Paper 44/21(No longer available online).
44-21P probesExCo selected option 2 in the paper. I thought this was Option 1?
“Probes to Measure Stanley and Camp Broadband Performance. Probes are purchased to measure the performance of the broadband service in Stanley and across Camp at a cost of £xxx,xxx. Option 2 would deploy 12 probes across the network to provide representative fixed and mobile broadband data rate measurements for all Sure customers. Option 2 is cost effective and is selected as the preferred option.”
Whether the option selected was “cost-effective” was questionable.
The timescales proposed for the installation of the Probes were as follows:

These twelve ‘probes’ locations were not provided to the public at this time.
2021: Communications Regulator Report –Broadband Probes.
“a. Following research and discussion with Sure, the Regulator concluded that the best way forward with monitoring of the broadband service was through the deployment of broadband probes throughout the mobile and fixed network to measure a number of parameters including data rates.
b. In Feb 21, EXCO approved the purchase of 12 probes (6 mobile, 6 fixed) to be deployed in Stanley and Camp on both MSA and WiMax technologies. Following contract and acquisition all 12 probes were deployed by 21 Jan 22. As Sure benefits from the data provided by the probes they contributed 25% of the capital costs.c. The Regulator is now working with Sure to agree how the probes will operate and report measured data, how the data will be used to generate report and how probe data will be integrated into quarterly Quality of Service reporting.
2022: Communications Regulator Report
“The reduced resources available during 2022 meant that several important matters were delayed and must now be address d as a priority during 2023. These matters include: Updating the Quality-of-Service reporting framework. The broadband probes installed across the Sure network have provided monthly information on data rates and service availability throughout 2022. This information now needs to be analysed and used to establish realistic quality of service targets to be incorporated in the Quality-of-Service reporting framework.”
2023: Communications Regulator Report
“Updating the Quality-of-Service reporting framework. Broadband probes installed across the Sure network have provided monthly information on data rates and service availability throughout 2022/23. However, anomalies in the data, especially as regards line speeds, have complicated the process of establishing key performance targets (KPIs) to be incorporated in the Quality-of-Service reporting framework. However this work in now nearing completion.”
“There were concerns about the quality and usability of data derived from the probes – as there should have been, as the probes couldn’t provide relevant or trustworthy data regarding upload and download speeds.”

Some objective information at last?
2023: The Communications Regulator’s 2023 Quality of Service report provided updated information about the Probe programme. The meaning of “Line speed” was never defined.
The report states that probes were installed at:
- ADSL services at Stanley, Pebble Island and Cove Hill;
- LTE services at Mount Pleasant, Mount Kent, Goose Green, Fox Bay, East Stanley and Earth Station
- WiMax services at Pebble Island, Mount Kent and [Stanley] Earth Station.
In respect to ‘line speed’, it went on to state:
“Data was collected from these probes throughout 2022 with the aim of setting KPI targets for 2023 that are realistic and achievable but also sufficiently ambitious to encourage service-level improvements. Problems with the line speed data meant that it was not possible to establish a suitable KPI”
This was the most impactful – almost ironical – statement in the report:
“The small size of the test files, which means that the overheads
associated with starting up and closing down the data transmission are
exaggerated. Increasing the size of the test files would help address this
problem, but this would mean that the probe data would itself contribute
more significantly to overall network data volumes and may increase the
congestion rate experienced by customers.
“No line speed targets have been set for 2024, but the Regulator will
continue to work with Sure to fine-tune the procedure for collecting data from
the probes, with the aim of setting appropriate targets in 2025.”
15th April 2024 Technology Development Group meeting
Deputy Director of Development & Commercial Services took an action to request AG where the data and report from the broadband probes was, after [it was] confirmed this data was provided to the regulator when IS brought this issue up.
5th March 2025: In section 5.3 of the Technology Development Group minutes, the deployment of probes was discussed; The main points raised were as follows:
- “…the probes hadn’t produced accurate measurements on speed”
- “…the probes were at their “end of life“
- “…could no longer be updated as they are now obsolete technology”
- “…looking into options to either replace the probes or look into something else, noting that the point of the probes was to set a KPI on speed, which hadn’t happened.”
- “…it may be pointless to replace them currently.”
March 31st 2025: 2024 Communications Regulator Report
“An outstanding issue throughout 2023 and 2024 has been the unreliable data produced by network probes. Network probes were jointly invested in by Sure and the Falkland Islands Government in 2021 to measure availability and line speeds. The data was to provide Sure with network management information and to inform on suitable Key Performance Indicators (KPIs) regarding service availability and line speed.
The probe data regarding line speed has proved to be unreliable with the result that no KPI for line speed has been established. The Regulator worked with Sure in 2024 to understand why this had happened and how the problems might be overcome during the remainder of the Sure licence. The outcome will be contained in the Quality of Service Report for 2024.”
Sadly, it looks like, somewhat belatedly, the probe programme was deemed to be a failure. Let’s now look at why this may have been.
Probe technology supplied by Witbe
I must emphasise that I have no ‘inside’ information on which Witbox was used and, more importantly, how it was used, so what I write is pure conjecture and only my personal views.
It has been stated that the manufacturer of the probes was a company called Witbe, who make several versions of the Witbox.
I must say that some alarm bells were set off when I went to their website and found no postal address, email address or telephone number – only a Contact field. They seem to be a Chinese company based in Zhejiang, China. More worrying is that I’ve been unable to find detailed technical or configuration information on their websites.
I would assume that a Witboxnet could be the model used.
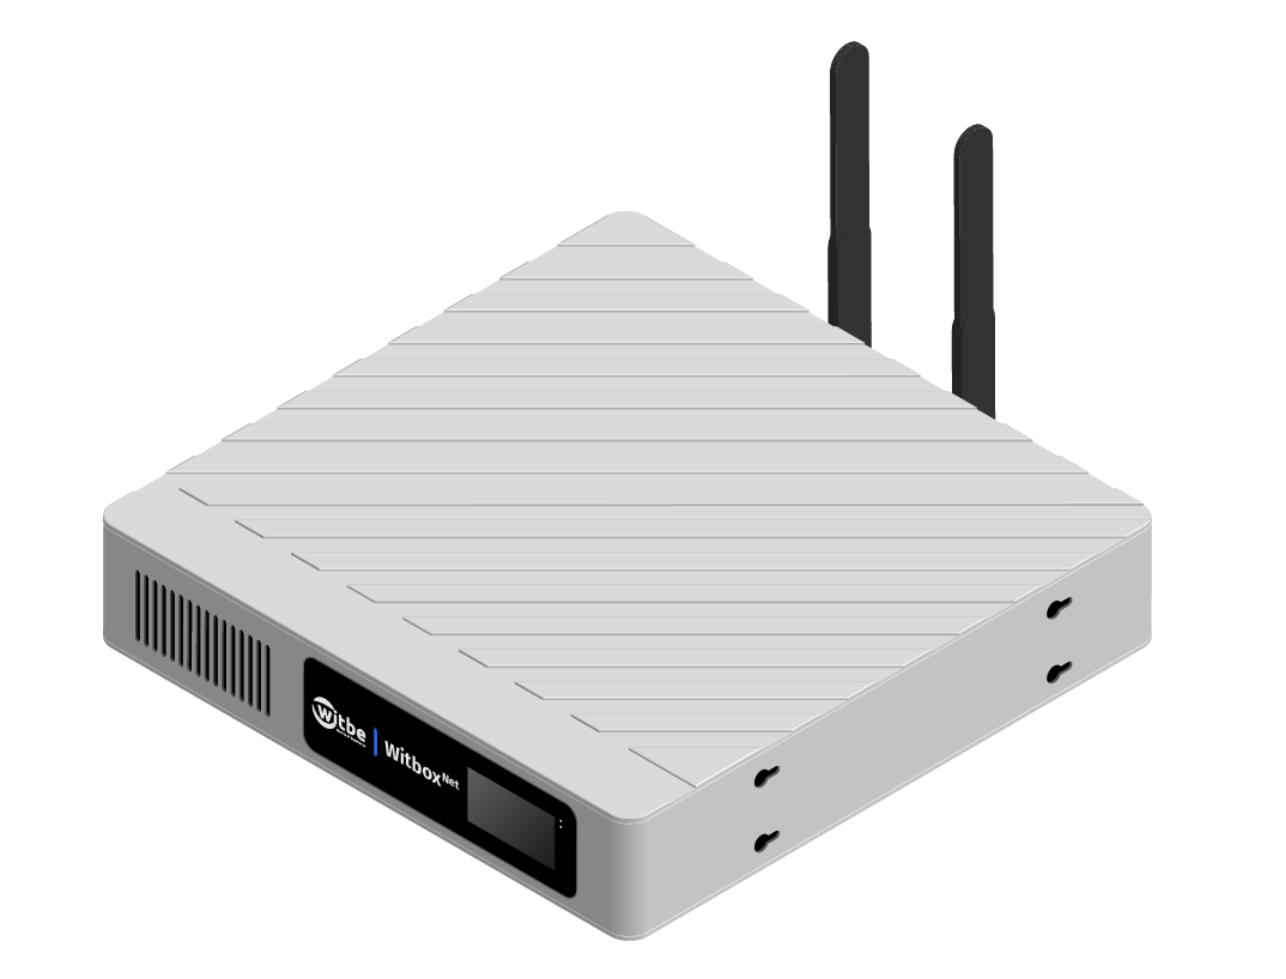
The choice of this box seems unusual in that it does not resemble any network probe technology – software or hardware-based – that I have come across for use on a carrier’s core network. It seems a rather strange choice. The key point is that all Witbox models seem to be designed to focus on testing and monitoring the capabilities of streaming video service providers.
However, monitoring ISP network parameters is not what the probe programme is about, whose prime objective was to evaluate user Quality of Experience, so why were these chosen? It does seem that the cheapest solution was selected.
The Witbox is still a current product and is still being advertised for sale ( At least the website is still live), so it is not at its “end of life”. I would suggest that what has happened is that the Support Agreement has run out, which means the end of software updates. Mind you, it does say on the web page, “When is it available? Today, while supplies last. So, grab yours fast!”
Here are a few products more traditionally used by carriers or ISPs for measuring network parameters, though there are many more that are well-known, such as Netflow, SolarWinds or Wireshark, etc.
- iPerf / iPerf3 – Measures TCP/UDP throughput, jitter, and packet loss between two endpoints.
- Flent (Flexible Network Tester) – Built on netperf and iperf, supports multiple simultaneous tests.
- netperf – Measures latency and throughput across different network protocols.
- NDT (Network Diagnostic Tool) – Tests upload/download speeds and detects network issues.
What’s the difference between Quality of Service and Quality of Experience?
Quality of Service (QoS) and Quality of Experience (QoE) are related but distinct concepts in networking and service delivery. QoS refers to a network or service’s technical and objective performance metrics, typically measured using parameters such as bandwidth, latency, jitter, packet loss, and reliability. It focuses on ensuring that the network or system meets predefined technical standards and service-level agreements (SLAs). For example, a VoIP service with low latency, high bandwidth, and minimal packet loss has good QoS. On the other hand, QoE is a user-centric measure that reflects how a person perceives and experiences a service. Unlike QoS, It focuses on the end user’s perception of how good a service is. For instance, even if a video streaming service has high QoS, with good resolution and fast loading, users may still have a poor QoE if buffering occurs at critical moments. A service can have high QoS but low QoE if user expectations are not met, such as when a technically efficient app is difficult to use. While QoE depends on QoS, it also includes psychological and usability factors that impact overall user satisfaction.
Why a Broadband Speed KPI for the Falkland Islands Won’t Work
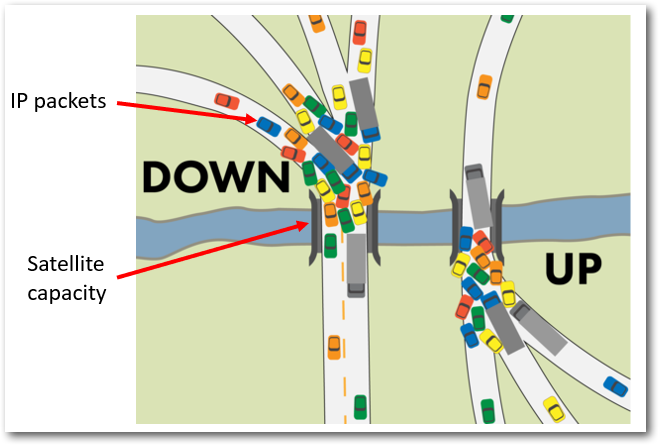 What satellite traffic congestion looks like.
These are some of what I wrote back in 2021. Nothing has changed in 2025.
To my mind, there are three key reasons why establishing a broadband speed KPI for the Falkland Islands is next to unworkable.
First: The primary cause of network congestion is not Sure’s local infrastructure (except in the case of Sure hotspots) but the Intelsat satellite link connecting the islands to the broader Internet. Network probes installed in Stanley and Camp cannot detect speed reductions caused by capacity overloads on this link. The only way to accurately diagnose congestion would be to place a probe at the far end of the satellite link, something Sure was unlikely to permit. Without this, any KPI would only reflect congestion on Sure’s terrestrial network, missing the real issue.
Second: Measuring broadband speed as a Key Performance Indicator (KPI) can lead to excessive network capacity usage due to the bandwidth-heavy nature of speed tests. These tests typically involve downloading and uploading large amounts of data to measure throughput accurately. When conducted frequently, they consume significant network resources, which can be especially problematic in areas with limited bandwidth or satellite connections.
This artificial increase in congestion can distort real-world network conditions and make it harder to assess actual performance. Additionally, multiple users or automated monitoring systems running frequent speed tests create unnecessary load on the Internet Service Provider (ISP), leading to higher-than-normal data usage, potential network slowdowns, and increased operational costs.
While speed tests provide valuable insights, excessive testing often leads to redundant data without offering much additional value. More efficient QoE metrics, such as latency, jitter, and packet loss, provide a clearer picture of user experience without the same bandwidth demands. Alternative methods like passive monitoring tools, including RIPE Atlas and SamKnows, measure network quality without generating heavy traffic.
Third: AS all ISPs do, Sure actively manages user download speeds to enforce a Fair Usage Policy, deliberately throttling speeds during peak congestion to prevent the satellite link from becoming overloaded. In extreme cases, it discards data packets, slowing connections further due to repeated transmission attempts. This standard ISP practice creates a clear risk as an ISP could manipulate speeds to meet any KPI thresholds set by FIG.
For transparency and objectivity, an independent third party should manage performance monitoring – not Sure. However, Sure opposes external oversight of probes on its network. Ultimately, FIG allowed Sure to install and operate the probes, undermining the credibility of any speed-based KPI. This is why attaching financial penalties to such a metric is impractical.

Possible Issues Leading to the Failure of the Probe Programme
Before outlining the key issues, I want to emphasise that I have no inside knowledge of the programme, the equipment used, or the specific reasons why the measured data was unusable. My observations are purely based on conjecture.
1. Lack of Clear Objectives and KPI Definition
One of the fundamental problems was the ambiguity surrounding the programme’s objectives and the specific Key Performance Indicator (KPI) being measured. Using undefined terms like “line speed” and “download speed” only added to the confusion.
-
“Line speed” refers to ISP’s backbone network traffic parameters. While this can indicate congestion in Sure’s terrestrial network, it does not provide actionable insights into user experience and is not a meaningful publicly available speed KPI.
-
“Download speed” generally refers to the speed an individual user experiences when accessing the Internet, which is more relevant to assessing the service known as ‘Quality of Experience’. A robust broadband speed KPI should account for multiple performance metrics, including:
-
Latency – The delay in data transmission, critical for applications like video calls and gaming.
-
Jitter – Variability in latency, which can disrupt real-time services.
-
Packet loss – The percentage of data packets lost during transmission, affecting reliability.
-
Throughput – The actual amount of data successfully transmitted over a connection, as opposed to theoretical maximum speeds.
Focusing solely on speed without considering these additional metrics provides an incomplete picture of broadband performance. In my opinion, the programme’s primary intent was to measure Quality of Experience, but it ended up with installed network probes that could only measure Quality of Service.
2. Network Segments Affecting User Experience in the Falkland Islands
Two main segments in Sure’s network topology contribute to internet performance degradation:
-
The terrestrial network connects Stanley and Camp users to Sure’s Point of Presence in Stanley (excluding the Intelsat satellite link). The Speed Test on Sure’s website only measures the provisioned speed (i.e., the speed users pay for). While this is useful for verifying that the expected speed being paid for is being delivered, it does not accurately reflect real-world user experience.
-
The international satellite connection – This link to the global internet backbone is the primary bottleneck, especially during peak usage hours.
To minimise costs, probes were installed in only a few locations within the terrestrial Sure network, which was insufficient to fully understand the performance of Camp’s WiMax and LTE wireless links. Crucially, no probe was placed at the far end of the satellite link, meaning accurate data on satellite link congestion was never collected.
3. Inadequate Speed KPI Methodology
A reliable speed KPI should be based on actual user experience, specifically ADSL performance. This requires:
-
Connecting a monitoring device or software to a user’s Ethernet router (not via Wi-Fi).
-
Measuring speed by connecting to dedicated servers located beyond the satellite link, similar to how Ookla Speedtest functions, is widely adopted by regulators worldwide, such as the FCC, OFCOM, France, Canada, etc.
Note: This method was previously used in the 2010–2016 FIG programme in partnership with Actual Experience, a e. However, Actual Experience is not available now, and SamKnows, another supplier active in this space, was recently acquired by Cisco.
Beyond just raw speed, potential broadband KPIs should measure:
-
Peak vs. off-peak performance – Identifying how speed fluctuates under heavy network load.
-
QoE (Quality of Experience) scores – Factoring in real-world user experience across different applications (e.g., streaming, gaming, cloud services).
-
Consistency of service – A connection that delivers 50 Mbps consistently is better than one fluctuating between 100 Mbps and 5 Mbps unpredictably, which is much more complicated than measuring availability or reachability.
4. Regulatory Oversight and ISP Involvement
Allowing an ISP to take, manage and report KPI measurements is a fundamental regulatory mistake which is akin to letting a company grade its own performance. Additionally, Sure actively manages traffic speeds because of the need to meet its Fair Usage policy. This means they have complete control over the Quality of Experience delivered to their customers. This raises concerns about impartiality in the measurement process.
Regulators worldwide, including Ofcom (UK) and FCC (USA), ensure broadband speed measurements are conducted independently using third-party tools. In most cases, these are crowdsourced via user devices or dedicated hardware probes installed in homes, with data anonymised and aggregated to protect privacy while providing accurate national performance benchmarks.
5. Questionable Supplier Choice?
As discussed earlier in this post
Two free or low-cost solutions could have been used to monitor the islands’ broadband service.
These are RIPE’s Atlas programme and Ookla’s Custom Speedtest service. Both of these – and others – were available in 2018 and 2019 when the probe programme was being defined.
The no-cost RIPE Atlas programme
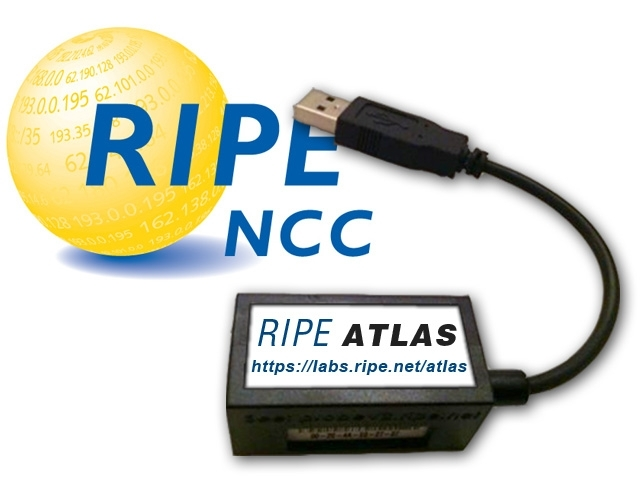 A function of the probes was to measure the length and number of outages over three-month periods for use as a KPI. There was no need to make such a significant investment to create this function, as there is a major global programme run by RIPE – RIPE Atlas – that could have provided the ‘reachability’ functionality needed on a worldwide scale, with RIPE providing probes free of charge. The RIPE Atlas programme comprises approximately 12,000 probes deployed globally.
Indeed, several of these were successfully installed in Stanley (I was one of the programme’s Ambassadors) in 2022 as a trial.
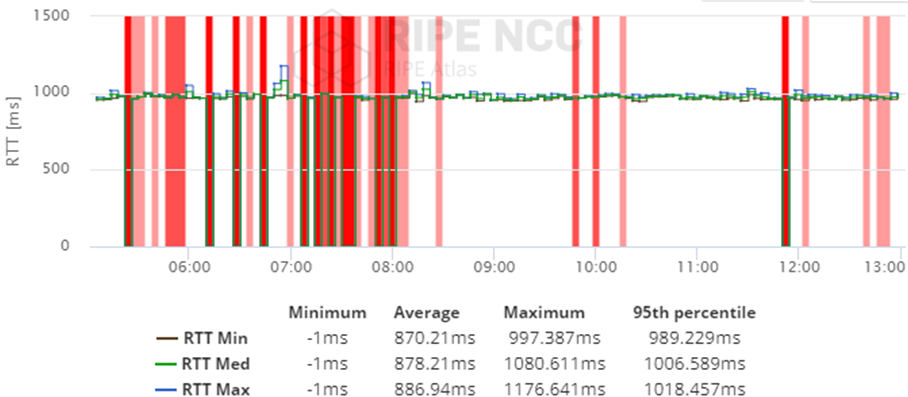 Atlas probes measuring Real Time Trip Delays (RTD) over a satellite link
“RIPE is the Regional Internet Registry for Europe, the Middle East and parts of Central Asia. As such, we allocate and register blocks of Internet number resources to Internet service providers (ISPs) and other organisations.
We’re a not-for-profit organisation that works to support the RIPE (Réseaux IP Européens) community and the wider Internet community. RIPE membership consists mainly of Internet service providers and telecommunication organisations.
Our ambition is to create an opportunity for unexpected and creative uses of Internet traffic measurement data based on the world’s largest active measurement network. We believe this data is valuable for network operators, researchers, the technical community, and anyone interested in the healthy functioning of the Internet who wants to learn more about the underlying networking structures and data flows that keep the Internet running globally.”

A 2017 proposal for a low-cost broadband speed monitoring capability by Ookla
 In 2019, I proposed that a custom monitoring service based on the automated OOKLA Speedtest service could be used at low cost- http://www.ookla.com/speedtest-custom.
 OOKLA’s custom Speedtest 2020 costs
I proposed that the monitoring programme be set up on the following lines several years ago.
1 Purchase the OOKLA custom Speedtest service starting at $5,000 in 2025 with an additional server for $995 to be placed in the Falklands. There would be other costs associated with the proposed programme.
2 A local IT organisation – perhaps FOG’s IT department – would use a local server and Ookla’s many thousands of servers worldwide.
3 An advert would be placed in Penguin News to locate volunteers to use the Ookla programme. This approach was successfully achieved with FIG’s broadband monitoring service run from 2010 to 2016. The IT company would manage the Volunteers team.
5 The independent IT company would use the Speedtest dashboard to collate and analyse results and create a monthly report for use by stakeholders.
I set up a test page in 2022 – http://fig.speedtestcustom.com/result/76ef5c50-695e-11e7-b898-9704a59b1fd5
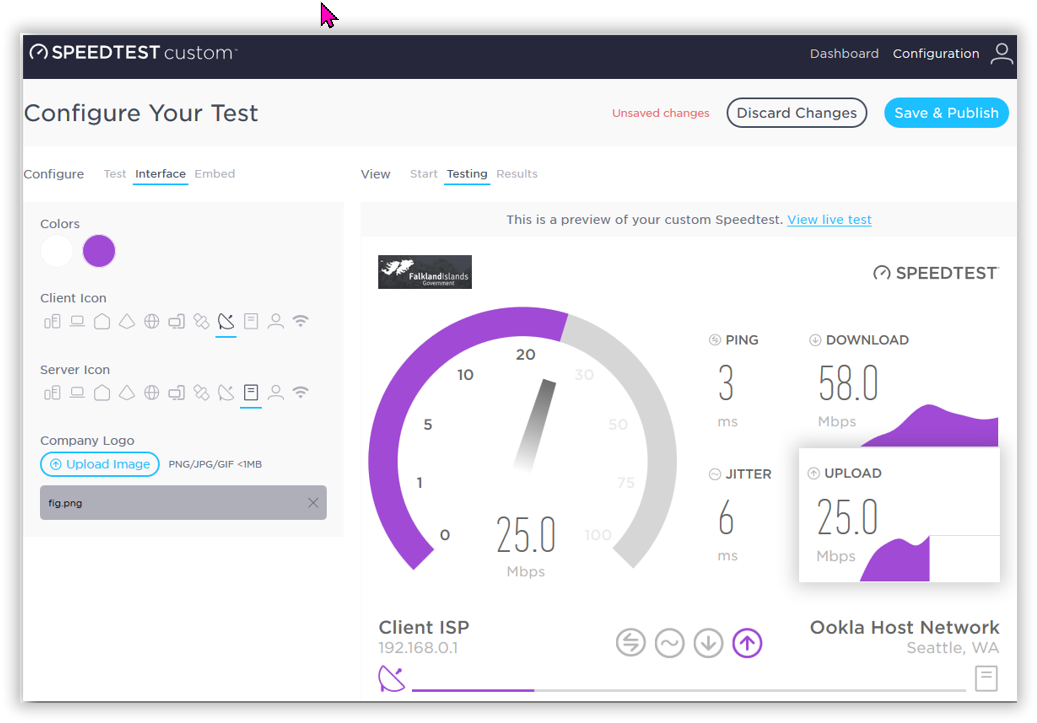
I believe such monitoring services discussed here would cost-effectively address the need for an independent, low-cost monitoring programme.

FIG’s 2010 – 2016 FIG QoE programme.
The Actual Experience broadband programme measured 40 Stanley and Camp volunteers’ QoEs using only latency, jitter, and packet loss data, as measuring actual download speeds would have consumed way too much of volunteers’ data quotas – this is not needed to measure QoE anyway. Data was recorded every few minutes. Here are example plots of QoE data collected.
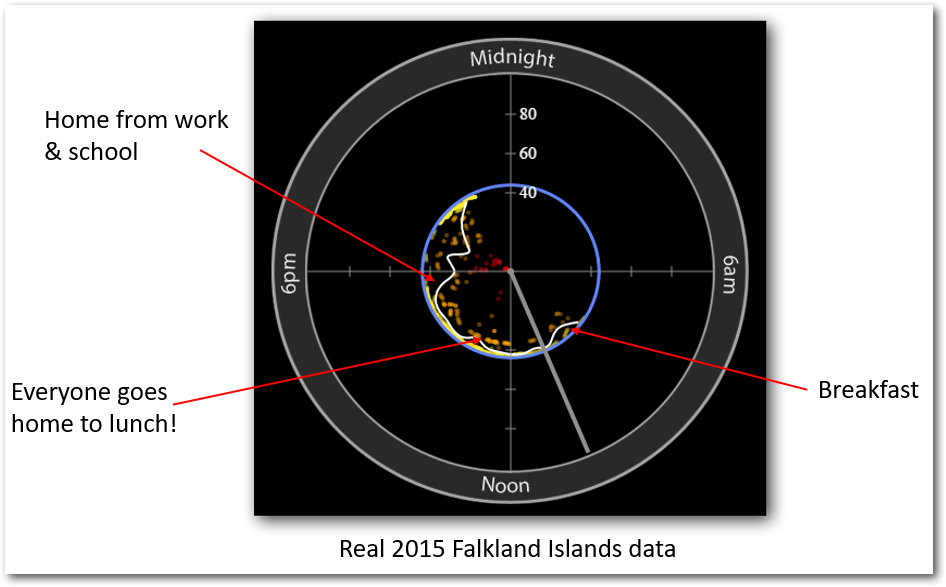 Daytime congestion as recorded in 2015
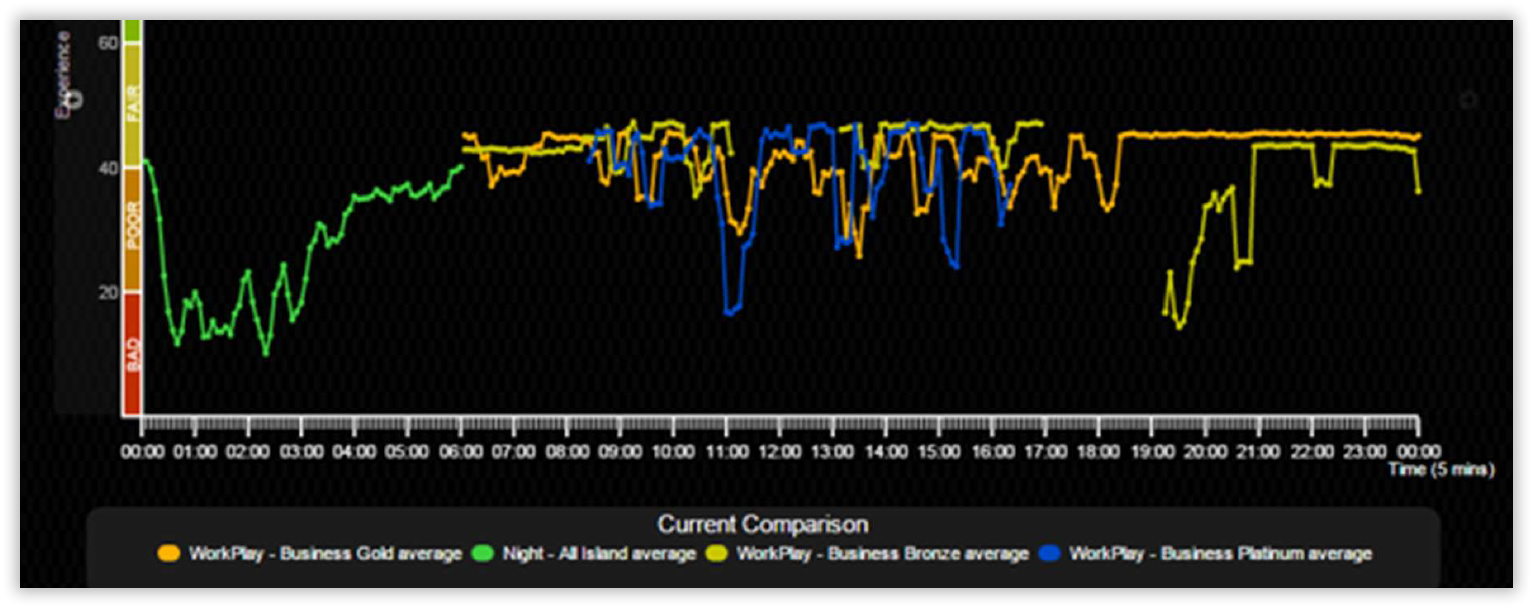 Typical Quality of Experience data for 24 hours – notice the performance during the nighttime free period.
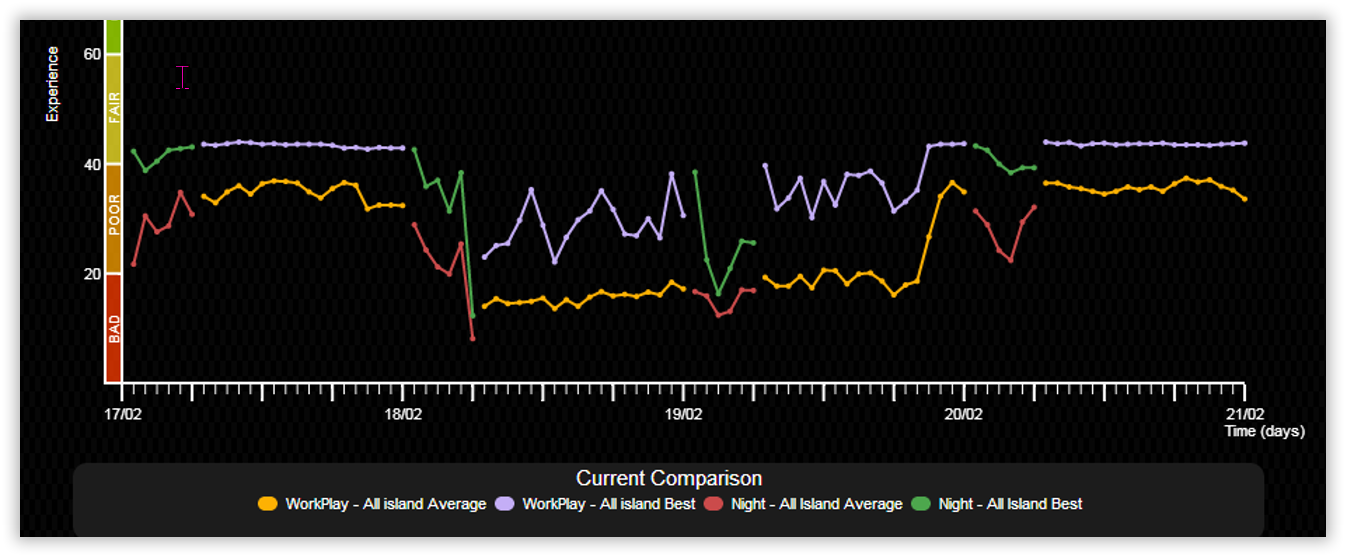
The 18th February 2014 ‘event’ started at around 05:00 in the morning when the all-island day and night QoE scores started to drop significantly. The event lasted until 20:30 on the 19th February 2014.
Sure’s stated reason for the poor QoS was:
“The cause of the issue on the 18th to the 19th February was unusually high internet traffic levels outside the Sure network that lead to periods of congestion. This was outside of the control of Sure but we did everything we could to minimise the impact on our customers. ”
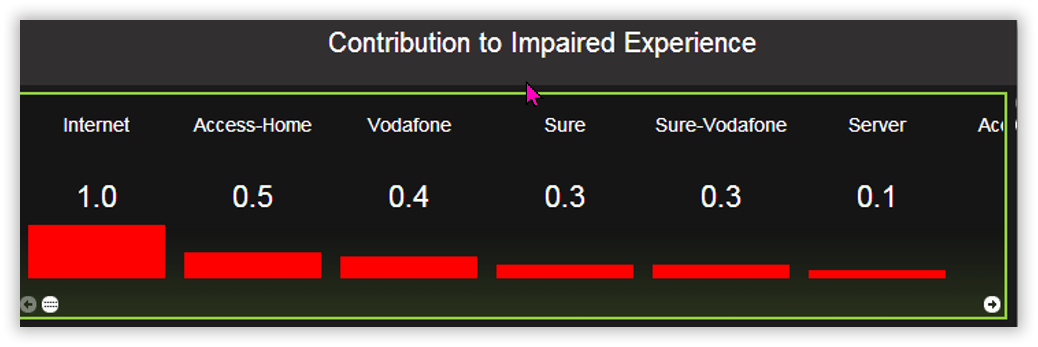
Typical congestion allocation in the end-to-end route from volunteers’ home PCs
to the AE web server in the UK.
- Home: This includes home Wi-Fi routers or a business LAN.
- Access: ADSL access circuit. This will indicate whether a user is overloading their DSL access link.
- Sure: This includes Sure’s domestic network, the satellite link and the border router in Whitehill, UK.
- Vodafone: This includes C&W Worldwide’s ‘global backbone’ that Sure use to connect to the Internet.
- Sure-Vodafone: Impairments that AE is unable to attribute to either Sure or Vodafone with confidence as the impairment is located at the network boundary between the two companies.
- Internet: This includes any other Internet service providers used to connect C&W Worldwide to AE’s server in Bristol and AE’s server.
Note 1: I managed the FIG’s Quality of Experience programme from 2010 to 2016, which utilized Actual Experience’s service.
Note 2: Unfortunately, Actual Experience closed its doors in 2024.
Conclusions
It is hard to parse the failure of the probe-based speed KPI fully. Still, it could largely be attributed to a lack of clear objectives, a lack of clarity about what was supposed to be measured, inadequate methodology and technical misunderstandings. The programme’s effectiveness was further undermined by the limited placement of probes and the failure to measure beyond the satellite link, which prevented an accurate assessment of network Quality of Service (QoS).
Additionally, allowing Sure to oversee the monitoring process raises concerns about impartiality as Sure’s day job is to manage QoE to maintain a good Fair Usage Policy.. Best practices from global regulators such as Ofcom (UK) and the FCC (USA) emphasise the need for independent third-party measurement to ensure transparency and credibility. However, Sure was permitted to install, configure, and manage the probe programme, thus compromising the reliability of any broadband speed Key Performance Indicator (KPI).
Had one of the alternatives above been adopted, FIG could have achieved accurate and independent broadband performance monitoring at a fraction of the cost while adhering to international best practices. Adopting such solutions – independently managed by FIG’s IT department, perhaps – could have enhanced broadband oversight in the Falkland Islands, ensuring improved service quality for users.
Chris Gare, OpenFalklandsApril 2025, copyright OpenFalklands
